If running as a Docker image, make sure to port-forward the metrics endpoint
port. For, instance, to forward port 9090 on the local port 80, add the
following flag to your
docker run command: -p 9090:80Metrics
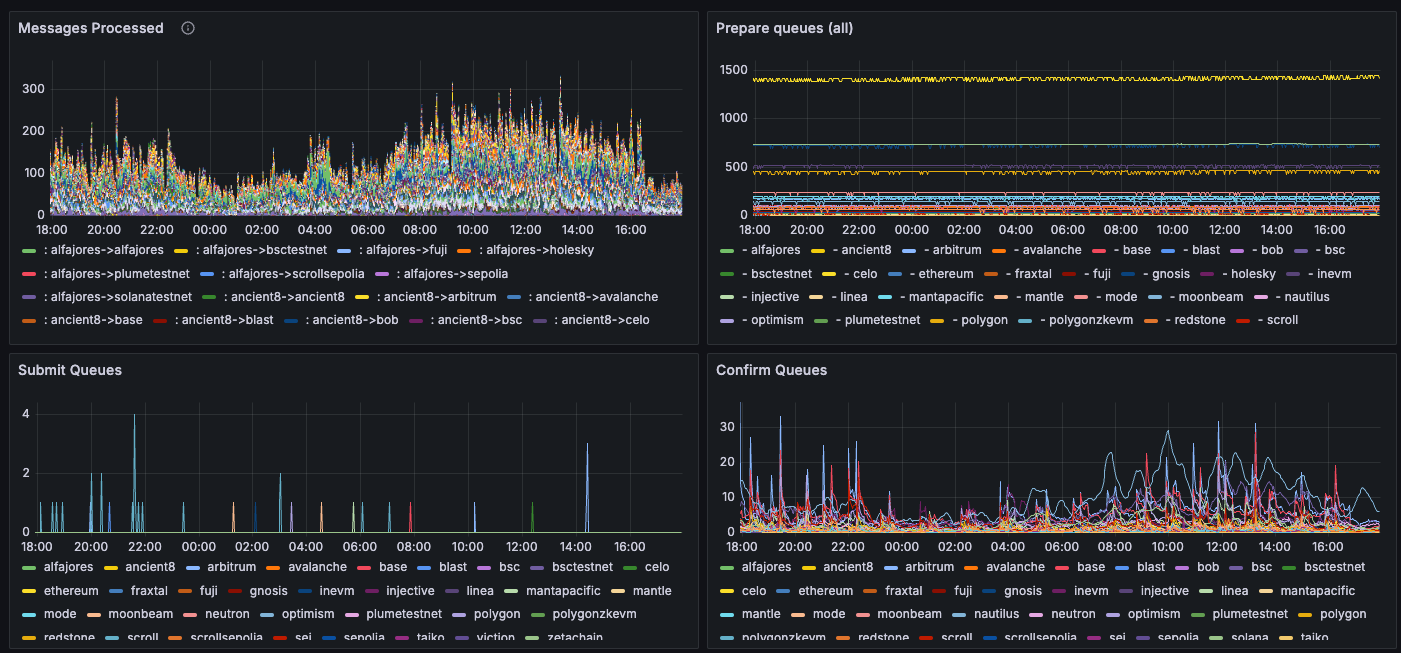
The dashboard template includes the following metrics.
Other relevant metrics include:
Alerts
The metrics above can be combined to create alerts that minimize false positives. Some example critical alerts:For all agents
hyperlane_block_heightfor any chain has not increased in the last 15 minutes- The rate of
hyperlane_request_count{status="failure"}in the last 10 minutes is > 60% of the rate ofhyperlane_request_count{status=~"success|failure"}. Most agent issues are due to bad RPCs, and this is likely to catch these issues.
For relayers
hyperlane_critical_erroris1for a chain, meaning the relayer has lost liveness there. While operations on other chains are not affected by this, this is a high severity alert - usually to do with unreliable RPCs for the affected chain.- Using
hyperlane_submitter_queue_length{queue_name="prepare_queue"}, the prepare queue length has been increasing, and the confirm queue length was zero, and error/warning count diffs have been increasing, over the last 30 minutes. This could mean that the relayer has run out of balance and cannot pay for gas, or that the destination chain RPC url is not working correctly, or just that all new messages are unprocessable hyperlane_wallet_balancehas dropped below a certain threshold. For example, the current balance divided by the difference in the last 24h is less than 2, meaning balance must be topped up within two days