> ## Documentation Index
> Fetch the complete documentation index at: https://docs.hyperlane.xyz/llms.txt
> Use this file to discover all available pages before exploring further.
# Monitoring & Alerting
Validators expose metrics on the port number specified by the argument . Port is the default, though any valid port can be chosen.
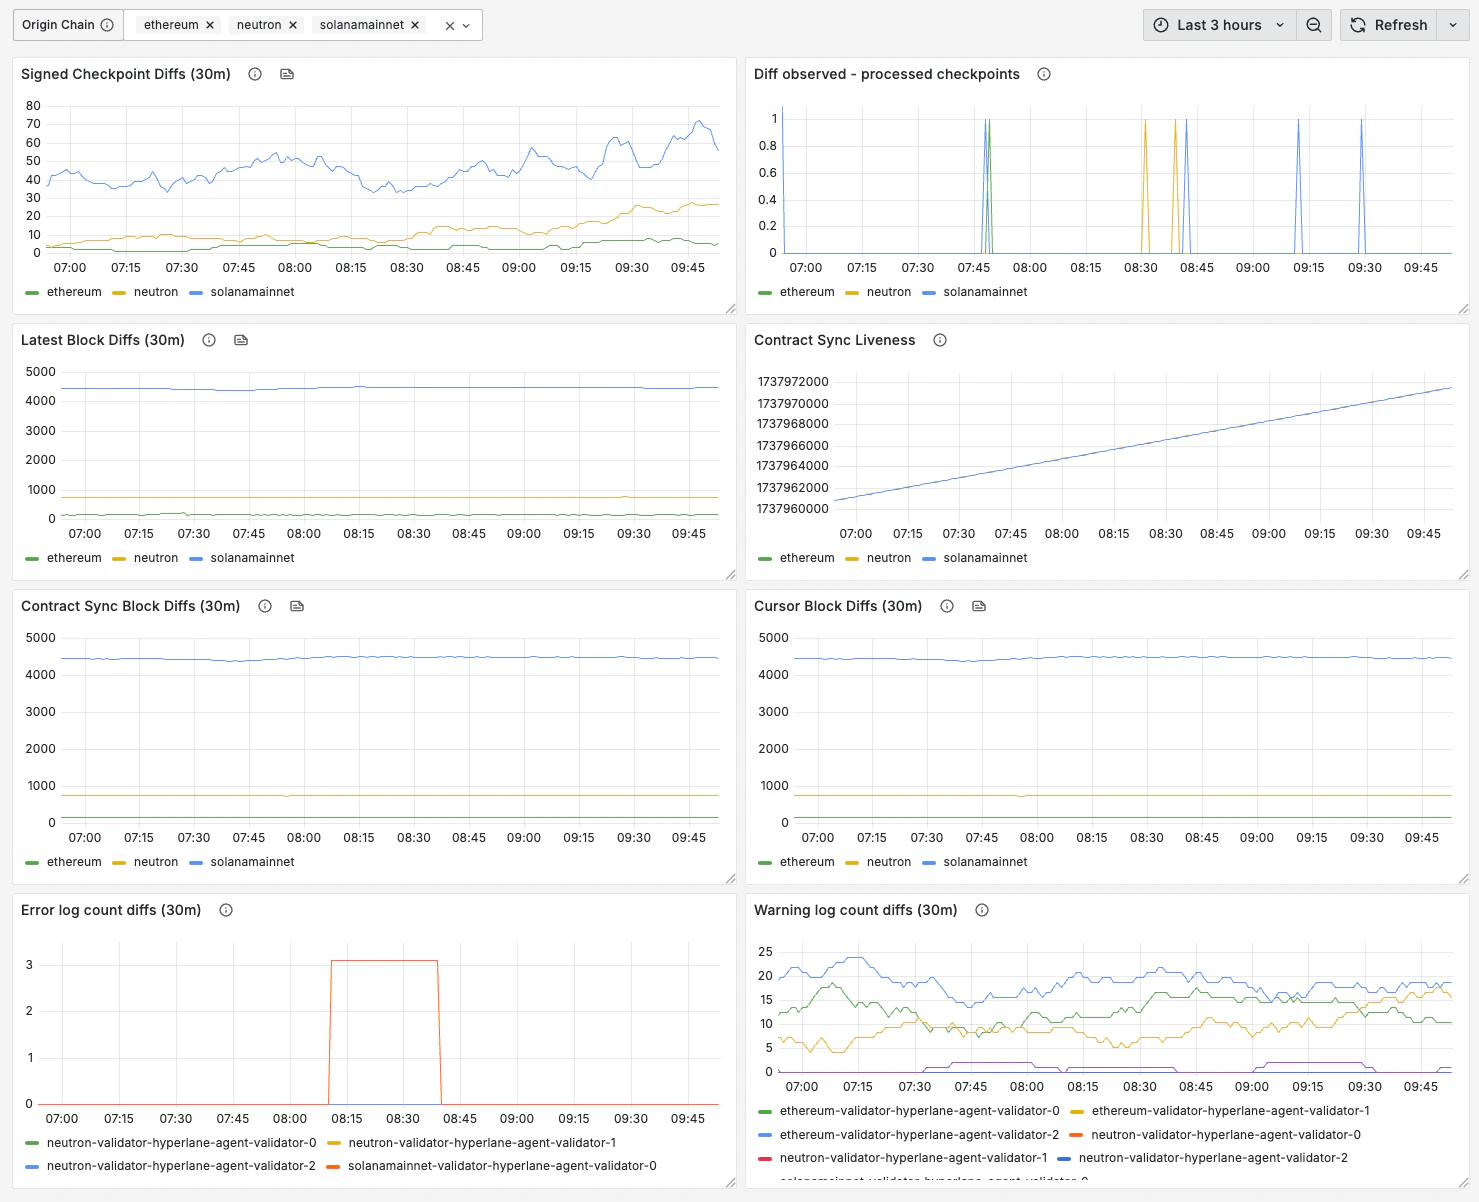
We recommend using Prometheus to scrape these metrics and Grafana to visualize them, using [this dashboard JSON template](https://github.com/hyperlane-xyz/hyperlane-monorepo/blob/84e8c5c218ac5d211c766cf4d5a135aee10e508c/tools/grafana/validator-dashboard-template.json), as seen below. The benefit of this dashboard is that it displays multiple validators at the same time. The screenshot shows metrics grouped by chain or by kubernetes pod.
 If running as a Docker image, make sure to port-forward the metrics endpoint
port. For instance, to forward port 9090 on the local port 80, add the
following flag to your `docker run` command: `-p 9090:80`
## Metrics
The dashboard template includes the following metrics.
| Metric | Description |
| --------------------------------------------------------------------- | ------------------------------------------------------------------------------------------------------------------------------------------------------------------------------------------------------------------------------------------------------------------------------------------------------------------------------------------------------------------------- |
| `hyperlane_latest_checkpoint` | The latest checkpoint observed by the validator |
| `hyperlane_block_height` | The block height of the RPC node the agent is connected to. This metric is updated periodically independently from the checkpoint indexing functionality of validator. |
| `hyperlane_contract_sync_liveness` | The timestamp which is reported on every iteration of the indexing loop of validator. |
| `hyperlane_contract_sync_block_height` | The block height observed by validator as part of indexing loop. |
| `hyperlane_cursor_current_block` | The block height observed by internal cursor of the validator. |
| `hyperlane_span_events_total{agent="validator", event_level="error"}` | The total number of errors logged, visualized as 30 min increases ("Error log count diffs"). If the derivative of this metric exceeds 1 over the last hour, at least a low-severity alert is warranted. Note that the dashboard query groups metrics by kubernetes pod name, so you may need to adjust this query if you are not running in a kubernetes environment. |
| `hyperlane_span_events_total{agent="validator", event_level="warn"}` | The total number of warnings logged, visualized as 30 min increases ("Warning log count diffs"). If the derivative of this metric exceeds 1 over the last hour, at least a low-severity alert is warranted. Note that the dashboard query groups metrics by kubernetes pod name, so you may need to adjust this query if you are not running in a kubernetes environment. |
## Charts
The dashboard template includes the following charts.
| Chart | Description |
| --------------------------------------- | ------------------------------------------------------------------------------------------------------------------------------------------------------------------------------------------------------------------------------------------------------------------------------------------------------------------------------------------------------------------------- |
| `Signed Checkpoint Diffs (30m)` | The latest checkpoint observed by the validator, visualized as 30 min increases. If values not positive in spite of `Latest Block Diffs (30m)` stable, it could mean that either there are no new messages, or that the validator stopped signing checkpoints. |
| `Diff observed - processed checkpoints` | The difference between checkpoints which validator observed on blockchain and the checkpoints which validator signed and published. This chart should be zero most of the time with occasional and short lived positive values. If it is positive for extended period of time, it means that validator has issues with signing and publishing checkpoints. |
| `Latest Block Diffs (30m)` | The block height of the RPC node the agent is connected to, visualized as 30 min increases ("Latest block diffs"). If this metric is not increasing, the RPC may be unhealthy and need changing. |
| `Contract Sync Liveness` | Renders metric `hyperlane_contract_sync_liveness` as it is. The graph should always go up. If it is constant, it indicates an issue. If chart contains metrics for several chains, they will be rendered on top of each other. It is normal when nothing is broken. Deviations will be visible if there is an issue which should be investigated. |
| `Contract Sync Block Diffs (30m)` | Renders metric `hyperlane_contract_sync_block_height` as 30 min increases. It should approximately match the number of blocks produced by the chain during last 30 minutes. If the metric deviate significantly in any direction, becomes zero, it should be investigated. |
| `Cursor Block Diffs (30m)` | Renders metric `hyperlane_cursor_current_block` as 30 min increases. It should approximately match the number of blocks produced by the chain during last 30 minutes. If the metric deviate significantly in any direction, becomes zero, it should be investigated. |
| `Error log count diffs (30m)` | The total number of errors logged, visualized as 30 min increases ("Error log count diffs"). If the derivative of this metric exceeds 1 over the last hour, at least a low-severity alert is warranted. Note that the dashboard query groups metrics by kubernetes pod name, so you may need to adjust this query if you are not running in a kubernetes environment. |
| `Warning log count diffs (30m)` | The total number of warnings logged, visualized as 30 min increases ("Warning log count diffs"). If the derivative of this metric exceeds 1 over the last hour, at least a low-severity alert is warranted. Note that the dashboard query groups metrics by kubernetes pod name, so you may need to adjust this query if you are not running in a kubernetes environment. |
## Alerts
All the metrics above can be combined to create alerts that minimize false positives. Some example critical alerts:
* the `hyperlane_latest_checkpoint` stopped increasing, but the `hyperlane_block_height` is still increasing, and `error` and `warn` log counts have also been increasing, over the last 6 hours
* `hyperlane_block_height` has not increased in the last 30 minutes
If you get alerted, always check the logs for what the problem could be.
If running as a Docker image, make sure to port-forward the metrics endpoint
port. For instance, to forward port 9090 on the local port 80, add the
following flag to your `docker run` command: `-p 9090:80`
## Metrics
The dashboard template includes the following metrics.
| Metric | Description |
| --------------------------------------------------------------------- | ------------------------------------------------------------------------------------------------------------------------------------------------------------------------------------------------------------------------------------------------------------------------------------------------------------------------------------------------------------------------- |
| `hyperlane_latest_checkpoint` | The latest checkpoint observed by the validator |
| `hyperlane_block_height` | The block height of the RPC node the agent is connected to. This metric is updated periodically independently from the checkpoint indexing functionality of validator. |
| `hyperlane_contract_sync_liveness` | The timestamp which is reported on every iteration of the indexing loop of validator. |
| `hyperlane_contract_sync_block_height` | The block height observed by validator as part of indexing loop. |
| `hyperlane_cursor_current_block` | The block height observed by internal cursor of the validator. |
| `hyperlane_span_events_total{agent="validator", event_level="error"}` | The total number of errors logged, visualized as 30 min increases ("Error log count diffs"). If the derivative of this metric exceeds 1 over the last hour, at least a low-severity alert is warranted. Note that the dashboard query groups metrics by kubernetes pod name, so you may need to adjust this query if you are not running in a kubernetes environment. |
| `hyperlane_span_events_total{agent="validator", event_level="warn"}` | The total number of warnings logged, visualized as 30 min increases ("Warning log count diffs"). If the derivative of this metric exceeds 1 over the last hour, at least a low-severity alert is warranted. Note that the dashboard query groups metrics by kubernetes pod name, so you may need to adjust this query if you are not running in a kubernetes environment. |
## Charts
The dashboard template includes the following charts.
| Chart | Description |
| --------------------------------------- | ------------------------------------------------------------------------------------------------------------------------------------------------------------------------------------------------------------------------------------------------------------------------------------------------------------------------------------------------------------------------- |
| `Signed Checkpoint Diffs (30m)` | The latest checkpoint observed by the validator, visualized as 30 min increases. If values not positive in spite of `Latest Block Diffs (30m)` stable, it could mean that either there are no new messages, or that the validator stopped signing checkpoints. |
| `Diff observed - processed checkpoints` | The difference between checkpoints which validator observed on blockchain and the checkpoints which validator signed and published. This chart should be zero most of the time with occasional and short lived positive values. If it is positive for extended period of time, it means that validator has issues with signing and publishing checkpoints. |
| `Latest Block Diffs (30m)` | The block height of the RPC node the agent is connected to, visualized as 30 min increases ("Latest block diffs"). If this metric is not increasing, the RPC may be unhealthy and need changing. |
| `Contract Sync Liveness` | Renders metric `hyperlane_contract_sync_liveness` as it is. The graph should always go up. If it is constant, it indicates an issue. If chart contains metrics for several chains, they will be rendered on top of each other. It is normal when nothing is broken. Deviations will be visible if there is an issue which should be investigated. |
| `Contract Sync Block Diffs (30m)` | Renders metric `hyperlane_contract_sync_block_height` as 30 min increases. It should approximately match the number of blocks produced by the chain during last 30 minutes. If the metric deviate significantly in any direction, becomes zero, it should be investigated. |
| `Cursor Block Diffs (30m)` | Renders metric `hyperlane_cursor_current_block` as 30 min increases. It should approximately match the number of blocks produced by the chain during last 30 minutes. If the metric deviate significantly in any direction, becomes zero, it should be investigated. |
| `Error log count diffs (30m)` | The total number of errors logged, visualized as 30 min increases ("Error log count diffs"). If the derivative of this metric exceeds 1 over the last hour, at least a low-severity alert is warranted. Note that the dashboard query groups metrics by kubernetes pod name, so you may need to adjust this query if you are not running in a kubernetes environment. |
| `Warning log count diffs (30m)` | The total number of warnings logged, visualized as 30 min increases ("Warning log count diffs"). If the derivative of this metric exceeds 1 over the last hour, at least a low-severity alert is warranted. Note that the dashboard query groups metrics by kubernetes pod name, so you may need to adjust this query if you are not running in a kubernetes environment. |
## Alerts
All the metrics above can be combined to create alerts that minimize false positives. Some example critical alerts:
* the `hyperlane_latest_checkpoint` stopped increasing, but the `hyperlane_block_height` is still increasing, and `error` and `warn` log counts have also been increasing, over the last 6 hours
* `hyperlane_block_height` has not increased in the last 30 minutes
If you get alerted, always check the logs for what the problem could be.